Model explainer — theory, significance, and formulas.
We explain the background and principle of each model in plain language so that newcomers to finance can follow along.
Markowitz Mean–Variance Optimization
"The most return for a given risk, the least risk for a given return." The founding pillar of Modern Portfolio Theory (MPT).
In one line
The first model to give a mathematical answer to how mixing different assets reduces the total risk of a portfolio. Harry Markowitz's 1952 paper is the foundation behind every modern claim that "diversification is the answer".
Why it matters
Before Markowitz, the conventional view was that "picking good stocks" was all of investing. He added two key insights on top of that:
- You must look at the risk of the whole basket, not the risk of a single name.
- Mixing assets that move differently reduces risk. — that is exactly what we now call the diversification effect.
For this contribution, Markowitz received the 1990 Nobel Memorial Prize in Economics. Almost every subsequent asset-management theory (Sharpe's CAPM, Black–Litterman, risk parity, etc.) takes this model as its starting point.
How it works
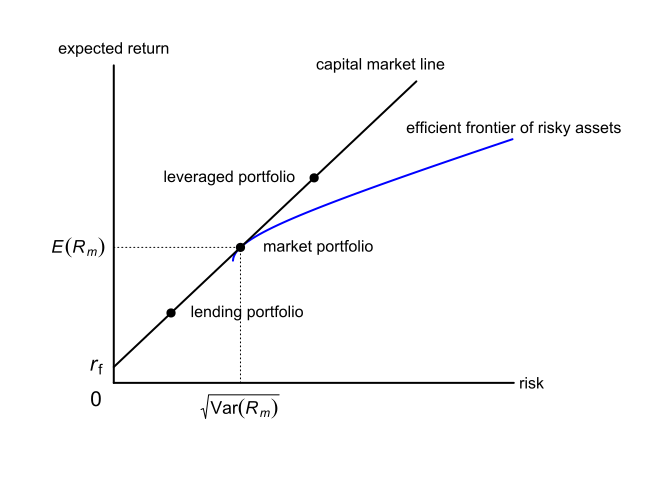
The Markowitz model plots every possible weight combination as a dot on a chart. The x-axis is risk (volatility, σ) and the y-axis is expected return (μ). The dots fall into a sideways-umbrella shape, and the upper edge of that umbrella is called the "Efficient Frontier". For a given level of risk, a weight combination on this curve delivers the highest return — every point below the curve is inefficient, because another weight combination achieves more return at the same risk.
The leftmost tip of the umbrella is the Minimum Variance Portfolio (MVP) — the weight combination with the lowest possible volatility. The curve that rises from there is the efficient frontier; the curve that drops below it (dashed) is the inefficient region, with lower return at the same risk. Theory always works on the upper curve and treats the lower region as "weights to avoid".
Adding the risk-free rate (e.g., a short-term Treasury, Rf) yields another result. From (0, Rf) draw the steepest possible line to the efficient frontier — the point where it touches the curve is the maximum-Sharpe (tangency) portfolio, the weight mix that gives the highest excess return per unit of risk. The line itself is the Capital Market Line (CML), and the theoretical conclusion (Tobin's separation theorem) is that every investor should hold their risky assets at this tangency mix and dial the overall risk level only with the risk-free asset.
Where it is used
The Markowitz model is not just a calculator — it is the most rigorous quantitative answer to "why you shouldn't put everything in one name."In practice it shows up in:
- Strategic asset allocation for pension funds and institutions (equities, bonds, alternatives)
- The core algorithm in most robo-advisors (a variant of mean-variance)
- Retail ETF reviews — is my portfolio on the efficient frontier?
- Evaluating whether adding a new holding actually improves diversification
Limitations
The model assumes that the means and covariances estimated from historical data will persist into the future. As the number of holdings grows, the covariance matrix becomes increasingly unstable. The HRP model, also covered on this page, was designed to address exactly this weakness.
Further reading
- Wikipedia — Modern Portfolio Theory · Overview of the efficient frontier, MVP and the tangency portfolio
- Investopedia — Efficient Frontier · Beginner-friendly explanation with worked examples
- Nobel Prize — Harry Markowitz (1990 Sveriges Riksbank Prize) · Official citation for the Nobel Prize in Economics
Run the Markowitz model on your own portfolio.
Enter your portfolio and the metrics explained above will appear as real numbers.